WARNING: This blog entry was imported from my old blog on blogs.sun.com (which used different blogging software), so formatting and links may not be correct.
I'm back!
I'm sorry I've been quiet on this blog, but I've just taken a long vacation. It's been a few years since my last long vacation, so I really enjoyed it. On top of that, we bought a house, moved and made some home improvements, and that turned out to be a lot of work. Anyway, I've been back several weeks now and I'm back in full swing. There are a lot of things going on. I'm doing various performance and stability fixes for NetBeans 6.5, I've done some updates in the Ruby support, and I'm also working on Python support. I'll definitely be saying more about that here, soon, but I'm not quite ready yet.
While I was on vacation, a high priority bug came in that I had to look at. It was basically complaining about a big memory leak, and my code looked like the culprit. So I used our memory analyzer. I hadn't used it before, but it was unbelievably easy and powerful, so I thought I'd show a couple of pictures of how to use it here, in case any of you have worried about your own memory leaks or how to fix them.
I'll show the actual bug I tracked down, so this isn't a made up fake example.
First, get a heap dump. In my case, the submitter had produced it - but if not, with Java 6 you can just run a jmap command to generate it from a running VM (more info).
Then, go to the Profiler menu in NetBeans and invoke Load Heapdump: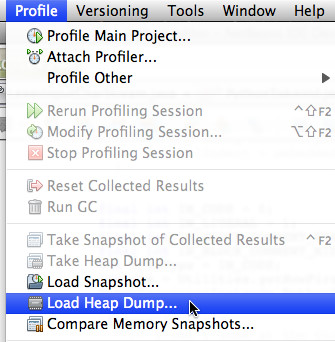
After NetBeans has loaded in the dump file, you can switch to the Classes view to see a sorted view of your memory usage.
There's a filter to let you search for specific classes, but you'll typically want to go for the classes near the top anyway
since that's where you're going to get bang for your buck.
Here I'm concerned with the javascript TokenStream.LexingState objects. So I have picked a class to focus on, and then I
ask NetBeans to show all the instances of my class in the heap:
You can now pick among the various instances in the left hand window and find one you don't believe should still
be in memory. Once you select it, NetBeans will search the heap to find the referenes which point to this instance.
So, you can look at all the objects in the heap of this class, and then you can follow references within the
objects to other objects, or in the References view (on the bottom), you can follow references backwards to see
who is pointing to this object, recursively!
Now, the really good part. I'm wondering why so many of these objects are still live - how are they referenced
from the top? I can right click on the object and ask it to show me:
NetBeans will search for a while, and then show a complete path from a GC root down to my object. Now I just
need to walk back from the GC root and examine each object to decide if it's justified in holding this
reference. In this screenshot I've selected the item which was the problem. As the little red badge
shows (also described in the legend at the bottom of the window), this is a static reference.
This class had created a static map which eventually end up holding a lot of context which should have
been freed up. Best of all, in this case, the culprit wasn't mine so I was able to dispatch the
bug to another developer and go back to my vacation :)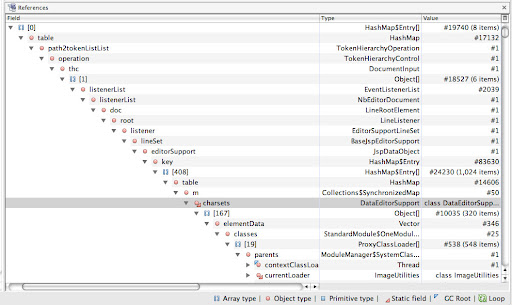
In C, you can have true memory leaks where you've allocated memory and you no longer have a reference to it,
so the memory is truly lost. In Java, with garbage collection, there's no true leak, only "unintentonally held memory".
In other words, this feature isn't just for those of you with memory leaks (where you're running out of memory).
You can use this feature to find out if you're holding more references than you're intending to. Freeing things
up can improve your application's performance and definitely reduce its resource requirements. So please give
it a try! I know there are other tools that can help track down memory issues - I've used some in the past - but
this was unbelievably simple (and by being integrated in my IDE, the Go To Source action on references made it
really tricky to figure out WHY there were references as I was checking each reference back from the GC root).