WARNING: This blog entry was imported from my old blog on blogs.sun.com (which used different blogging software), so formatting and links may not be correct.
"How did that text end up with a blue color?"
"Why doesn't my style rule to add underlines on links work? Is some other rule overriding it?"
"What style class do I need to override to change the font size of my Table headers?"
These are some questions you may ask yourself when you're designing
your web applications using
CSS.
Whenever you're dealing with CSS, the Mozilla DOM Inspector
is your best friend. It lets you examine the CSS rules and computed styles
for each of the elements in your document.
While it is extremely helpful in answering these questions:
"What CSS style rules apply to this element?" and
"What computed styles apply to this element?"
it is not as helpful with the (in my opinion more important) earlier questions.
For example, to find out how a particular element ended up with a
blue color, you need to start at that element, then look at all the
style rules applying to the element, look through its style declarations,
see if any have anything to do with color, and if not, go up to its parent
element and repeat the search.
Fortunately, there's a trick you can use: Creator's hidden DOM inspector.
This is a tool which is not a supported part of the product;
in fact it's a facility I added to aid debugging the webform layout
engine itself. But it turns out many of the questions I have to ask
are the same ones a page designer will ask: "How did that box end up
that wide", "What HTML did that component render", and so on.
(I have blogged about this
before, but there are new facilities in there for
CSS debugging which now sets it apart from the Mozilla DOM inspector.)

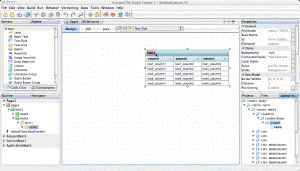
Here's how it works. Control-alt click on a component. The nearest
CSS box computed around the mouse click is selected with a red highlight,
and the property sheet selects a lot of the Box properties corresponding
to the HTML element rendered for the component. (Most components render
multiple elements; the DOM inspector works at the HTML level so you get
to see how rules apply to individual HTML elements.)
A couple of months ago I also added a little window display showing the
box hierarchy, so you can easily walk up and down in the box tree, like
Mozilla's DOM inspector lets you walk through the HTML Element tree.
One important feature here is that ask you click in the displayed page,
it expands nodes and selects the corresponding box. That's a feature I've
always missed in Mozilla's DOM inspector. Anyway, this part may have been
added right after EA2 went out so may not be available in your
version yet. But you can walk the hiearchy by pressing Escape to select
the parent box. Without the box tree window there's no way to descend;
you'll have to click on a box to select the closest leaf and then work
your way back up.
Here are the windows:
In the Layout Info window (on the left), the HTML tag is shown in angle brackets <>, and then the JSF component (if any) id is shown in italic.
The property display displays a number of interesting properties. I
may get back to some other ones later. But for CSS debugging, there
are two that really matter.
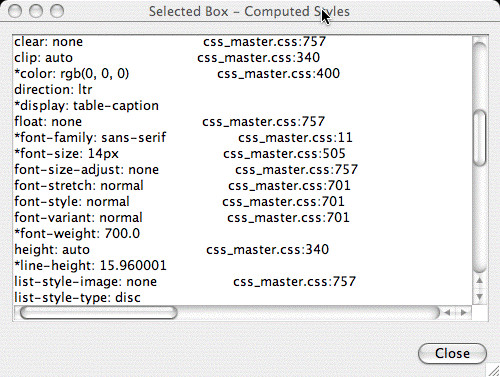
First, Computed Style:.
If you open the customizer, you'll see something like this:

This tells you a number of things. First, an asterisk (*) on the
left tells you that the value shown is different from the default
value of the property (e.g. has been overridden by somebody).
You then see the property, and the actual computed value.
The CSS2 properties are listed alphabetically.
Then, and this is the important part, it will try to tell you
where that particular value is coming from! This is shown
as the stylesheet name with a line number. This helps you answer
the initial questions. You can find the rule which is overriding
your intended rule.
(Note: Sometimes the line numbers are wrong - off by a couple.
Sometimes the line numbers are completely wrong. This happens
because I deliberately implemented the code which tracks style
usage to be extremely low overhead (since it's for debugging only),
and in particular, the CSS code tries to share Value objects
when possible. In cases where a single value object is used in
multiple places I cannot attribute different usage references,
so only the last one is recorded. Luckily, this doesn't happen
with attributes you are most likely to be interested in: font size,
color, width, height, etc.)
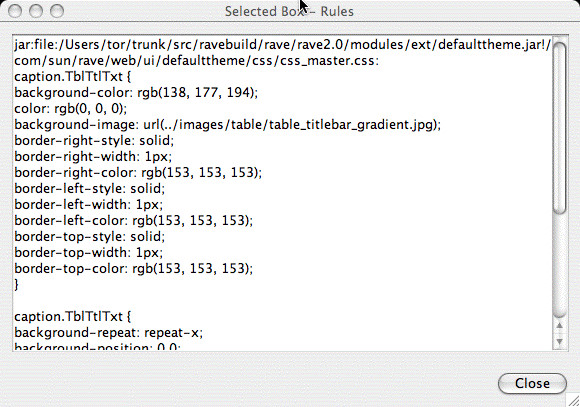
A second related facility is the "Rules" property. This
property lets you view which CSS rules apply to a particular
element. It is similar to the facility in the Mozilla DOM inspector.

(I added this property when checking my
performance optimization for CSS rule checking,
so it may not yet be in the version you're running.)

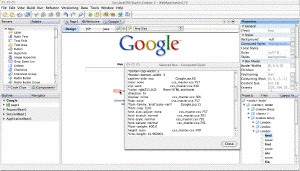
Here's a slightly different example. Take a look at the google
page for example. If I click on the word "New" (which is in red) because
I wonder where the Red is coming from, I see this in the Computed Style property editor:

As you can see, the color property is getting its value from an HTML
attribute.
Indeed, the JSP contains this:
<font color="red">New!</font>
The color is coming from the
color attribute. It's not always a
direct mapping; for example, a
bgcolor attribute maps to the CSS
background-color property, etc.
Note that since this is a debugging tool, I have packed in a lot of
information, and this information is not cached in any way, so the display
is pretty slow. Also, the window is not tried to be kept up to date
etc. so sometimes you need to close the Layout Info window, and
reselect boxes on the designer surface to see their updated properties
etc.
By the way, on the Mac, you need to use Alt-Click instead of
Control-Alt click, because Ctrl-Alt click is "reserved" on the mac.
Happy sleuthing!


